. 2017 Sep 26;6:e28673. doi: 10.7554/eLife.28673

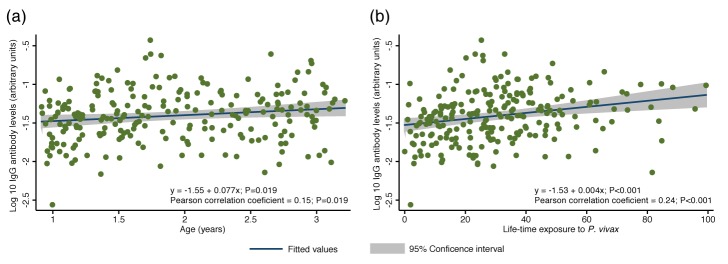
Figure 2. Association between cumulative IgG levels to 38 P. vivax proteins and exposure to P. vivax infections in Papua New Guinean children aged 1–3 years.

Figure 2.

(a) Association with age. (b) Association with lifetime exposure. For each child, exposure was defined as the total number of P. vivax blood-stage clones acquired per time-at-risk (molFOB), and lifetime exposure as a product of age and molFOB. n = 225. P values < 0.05 were deemed significant.

Figure 2—source data 1. Associations between IgG to P. vivax antigens with measures of concurrent and cumulative exposure in Papua New Guinean children aged 1–3 years.
Geom mean = geometric mean. Exposure was defined as the total number of P. vivax blood-stage clones acquired per time-at-risk (molFOB) and lifetime exposure as age multiplied by molFOB. Geometric mean IgG levels and 95% intervals are in arbitrary units interpolated form standard curves using a 5PL logistic regression model and were multiplied by 1000. For age and lifetime exposure, rho (r) and P values were calculated using Spearman's rank test. For infection status, IgG levels were log10 transformed and P values calculated using unpaired 2-tailed t tests. P values < 0.05 were deemed significant.
elife-28673-fig2-data1.docx (153.8KB, docx)
DOI: 10.7554/eLife.28673.005