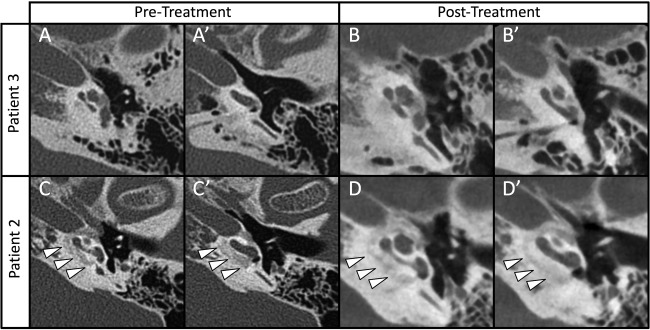
Figure 3.

Imaging of temporal bones from two patients with pre‐ and post‐treatment scans. Pre‐treatment images were obtained with traditional thin cut CT and subsequent imaging was obtained with cone‐beam imaging. Panels A and B demonstrate stable findings over time in Patient #3. While panels C and D show axial cuts demonstrating lucencies around the cochlea in 2005 (white arrow heads), these same areas appear more mineralized post treatment (D and D') in 2012. A similar effect was reported recently in a case by Jung et al.33
