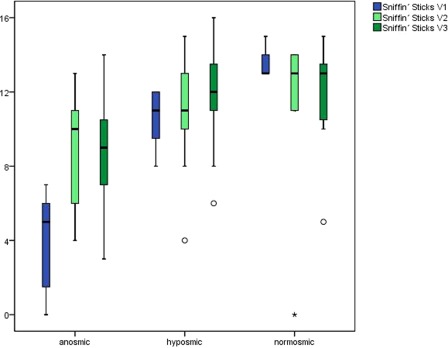
Figure 3.

Box plots of changes in Sniffin’ Sticks scores preoperatively (V1, blue), 2 weeks (V2, light green), and 6 months (V3, dark green) after surgery, considering the initial olfactory performance (anosmic, n = 15, hyposmic, n = 19 or normosmic, n = 7). The lines represent the medians; the boxes include 75% of the results; the whiskers include 95% of the results; the circles show outliers.
