Figure 7.

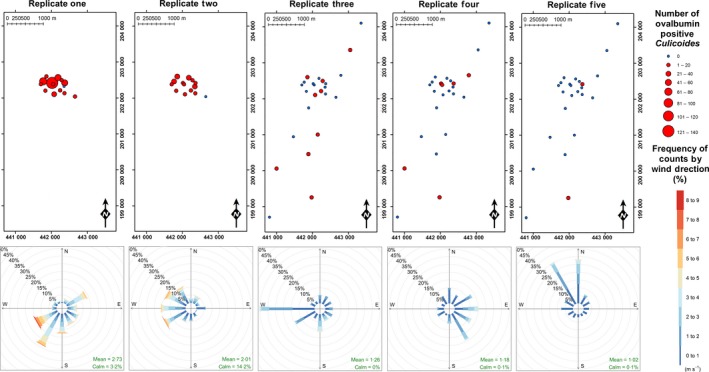
Locations of ovalbumin‐positive Culicoides collections and windroses displaying cumulative mean windspeed (ms−1) as a function of wind direction (°) summarised by replicate. [Colour figure can be viewed at wileyonlinelibrary.com]

Locations of ovalbumin‐positive Culicoides collections and windroses displaying cumulative mean windspeed (ms−1) as a function of wind direction (°) summarised by replicate. [Colour figure can be viewed at wileyonlinelibrary.com]