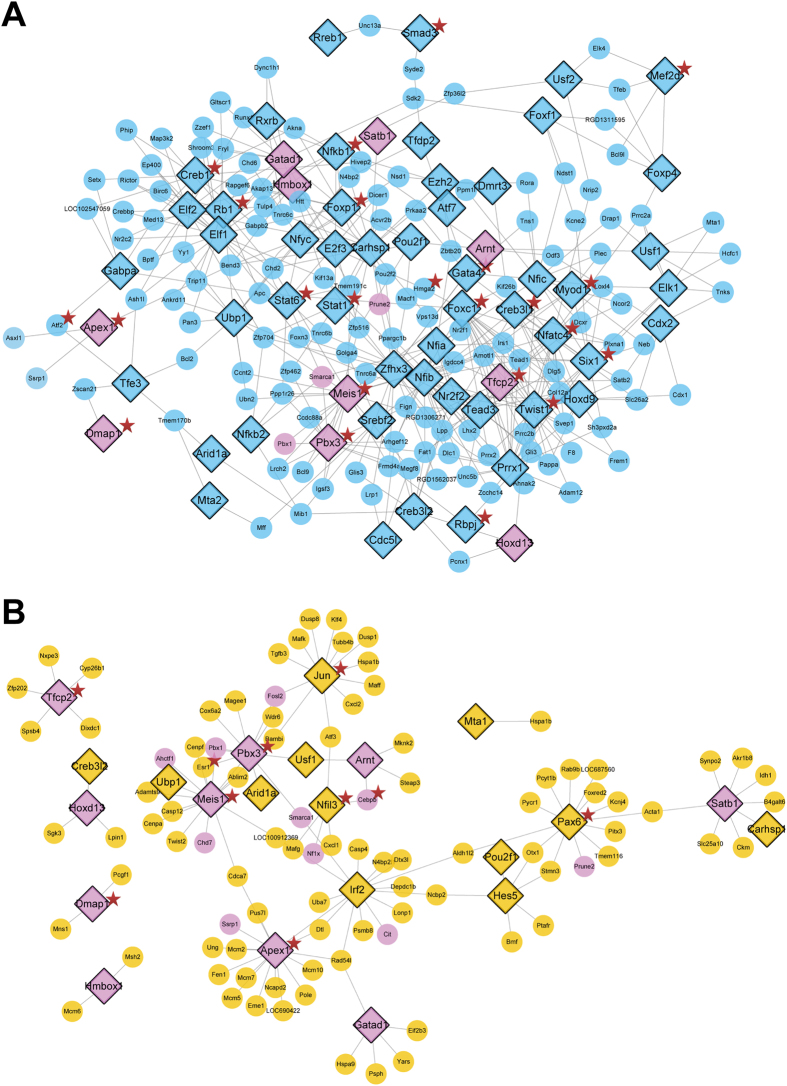
Figure 5.
The regulatory network of transcription factors (TFs) and their differentially expressed target genes (TG) as determined by TF-TG regulatory relationships from CellNet. (A) The TF-TG regulatory network of H9c2 cells treated with H2O2 in comparison to the control cells. Blue indicates TFs changed only in the model group compared to the control group. (B) The TF-TG regulatory network of H9c2 cells pre-treated with YXS in comparison to the model group. Yellow indicates TFs altered only in the YXS-treated cells. Pink indicates TFs that were co-regulated in both the model group compared with the control and the YXS group compared with the model group. A star marker was added to indicate TFs or targets that are involved in apoptotic processes.

