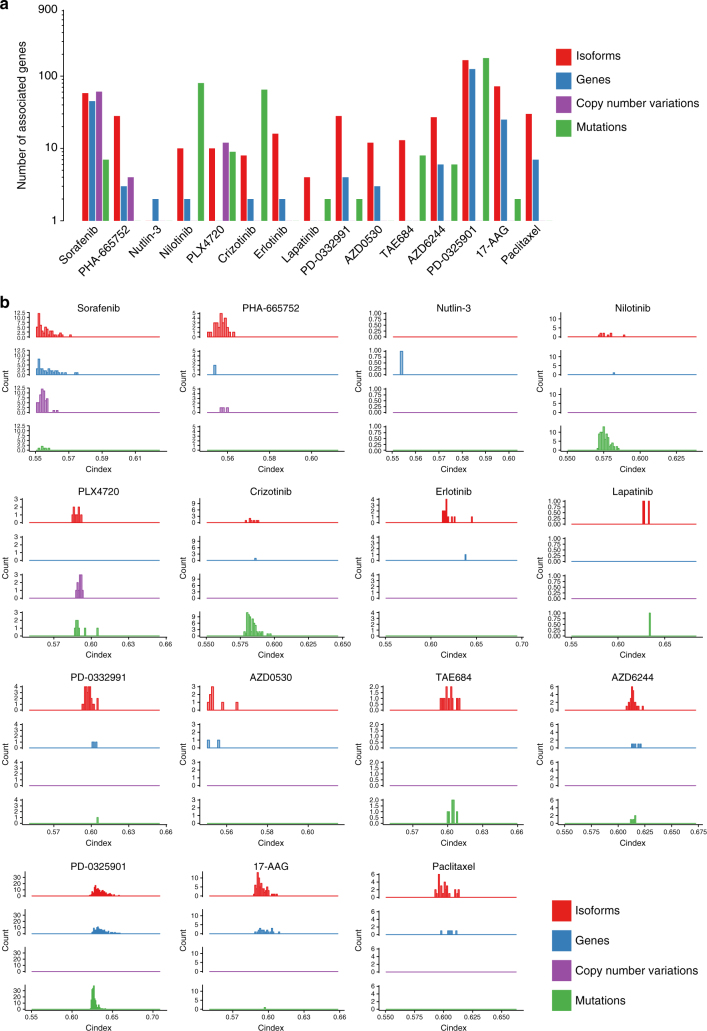
Fig. 3.
Comparison of significance and predictive value for multiple data types. The comparison is limited to 1600 genes for which mutations, copy number variation, and expression data were available. a Number of significant (FDR < 5%) biomarkers at the level of gene expression, isoform expression, mutation, and amplification. b Distribution of concordance indices (predictive value) of the significant biomarkers with respect to data type

