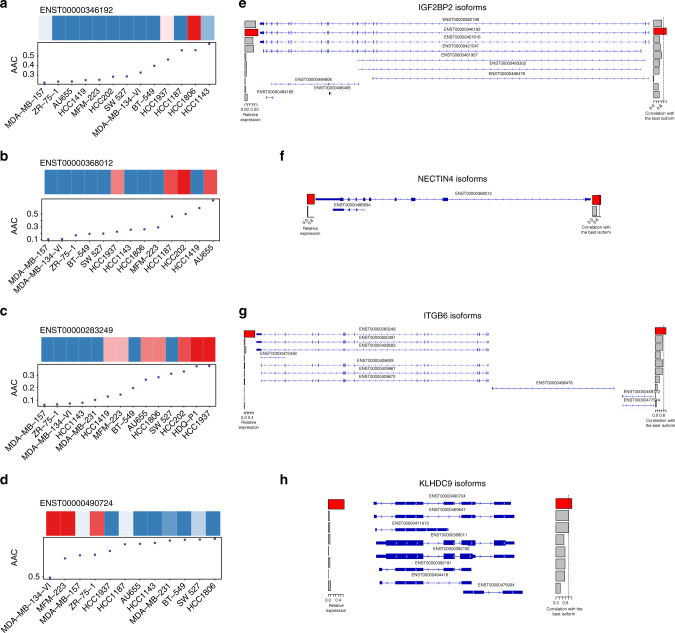
Fig. 6.
Validation of the candidate isoforms predictive of response to a, e AZD6244; b, f lapatinib; c, g erlotinib, and d, h paclitaxel in the independent UHN dataset generated where a different pharmacological assay (sulforhodamine B assay) was used to measure drug sensitivity. a–d Cell lines are ordered by their sensitivity to the drug of interest and their isoform expression is shown in the heatmap, with the drug sensitivity (AAC) plotted below. e–h Exon occupancy of each candidate isoform (*) is visualized using the Integrative Genomic Viewer, with a barplot on the right side representing the correlation (ρ) of expression between each isoform and the candidate isoform (red bar). A vertical dashed line represents ρ = 0.8 to identify highly correlated isoforms of the same gene

