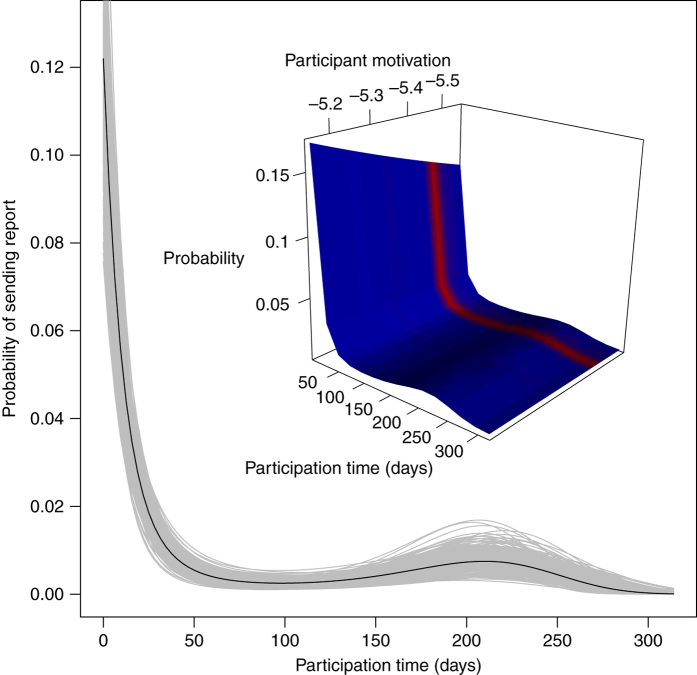
Fig. 4.
Reporting propensity. Probability of participant sending at least one report during a 24-h period as a function of participation time and participant’s intrinsic motivation (modelled as random intercept at participant level). Main: values for the mean random intercept. Each grey curve is based on a random draw from the posterior distributions of the participation time parameters; black is based on the mean of the posteriors. Inset: prediction surface with participant motivation (random intercepts) shown on x axis as continuous variable in observed range; surface colour represents density of participants at each random intercept value (red = higher; blue = lower)

