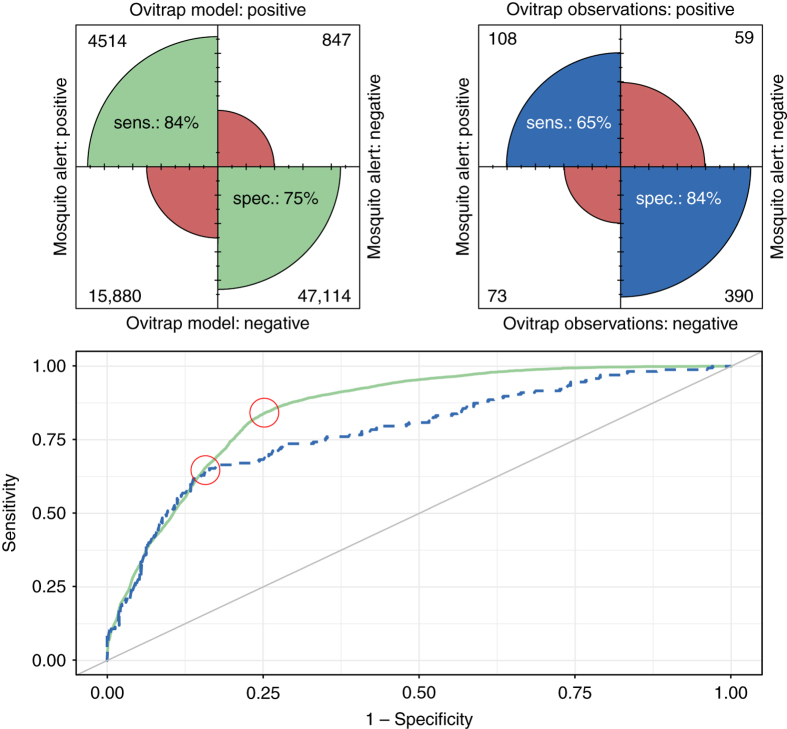
Fig. 6.
Receiver operating characteristic (ROC) curves (bottom) and confusion matrix plots (top) for Mosquito Alert human–mosquito encounter probability model predictions. Bottom: ROC curves show trade-off between sensitivity and specificity of biweek municipality predictions depending on the threshold used for predictions, with the area under the curve (AUC) providing a measure of classifier performance that is insensitive to changes in class distribution. Plot shows Mosquito Alert predictions of biweek municipal-level ovitrap model predictions (solid green line; AUC = 0.85) and observations (dashed blue line; AUC = 0.78). Diagonal line shows AUC = 0.50, which is the theoretical value for random guessing. Top: confusion matrix plots drawn using the thresholds that maximize the sum of sensitivity and specificity for the ROC curve drawn from the ovitrap model (left) and observed ovitraps (right). This threshold is indicated on the ROC curves themselves (bottom plot) with red circles

