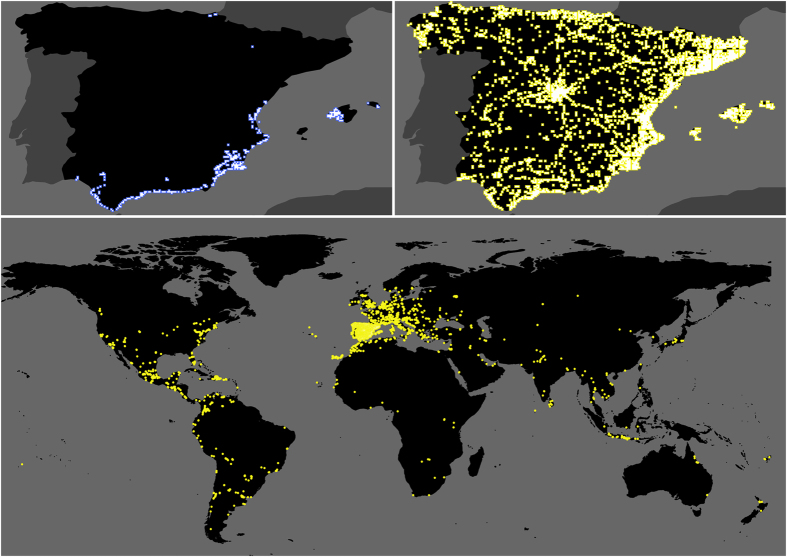
Fig. 8.
Ovitrap and citizen scientist locations. Top left: blue markers show locations of sampling cells containing the 1558 ovitraps used in the analysis, accounting for nearly all ovitraps placed in Spain during 2014–2015. Top right and bottom: yellow markers show locations of sampling cells in which Mosquito Alert participants were randomly sampled in Spain (top right, excluding the Canary Islands, Ceuta and Melilla) and around the globe (bottom) during 2014–2015. Sampling occurred on Android devices five times per day at random times between 7:00 am and 10:00 pm (and only if the participant did not opt out of the background tracking feature). In all cases, white square at centre of marker shows actual sampling cell size, while coloured border is used to ease visualization. Boundary data from Natural Earth (naturalearthdata.com)

