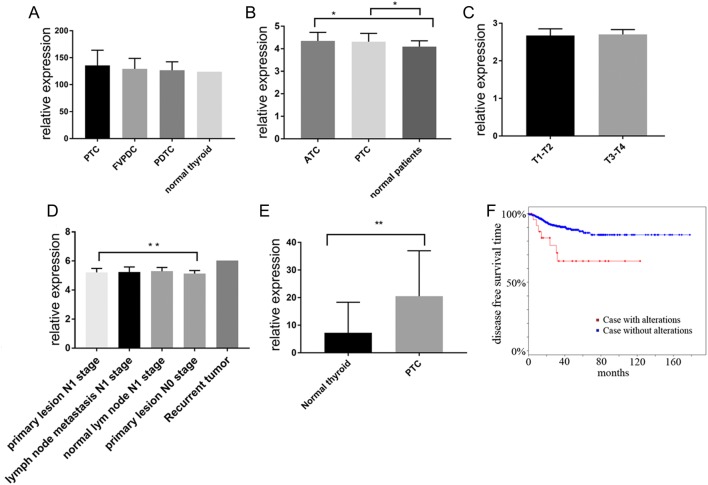
Figure 1.
RDM1 expression in thyroid cancer from the GEO and TCGA datasets. (A) RDM1 expression in PTC, FVPTC, PDTC and normal thyroid tissue (PTC, n = 7; FVPTC, n = 8; PDTC, n = 5; normal thyroid tissue, n = 1). Data source: GSE53157. PTC=135.8 ± 28.18, FVPTC = 129.2 ± 6.91, PDTC = 126.8 ± 6.99, normal thyroid tissue = 123.9. P = 0.88. (B) RDM1 expression in ATC, PTC and normal patients’ thyroid (ATC, n = 11; PTC, n = 49; normal patients’ thyroid, n = 45). Data source: GSE33630. ATC = 4.35 ± 0.38, PTC = 4.31 ± 0.37, normal thyroid = 4.09 ± 0.26. *P < 0.05. (C) RDM1 expression in T1–T2 and T3–T4 PTC patients (T1–T2, n = 21; T3–T4, n = 15). Data source: GSE65074. T1–T2 = 2.68 ± 0.04; T3–T4 = 2.71 ± 0.03. P = 0.57. (D) RDM1 expression in PTC primary lesion, lymph node metastasis, normal lymph node and recurrent tumour at N0 and N1 stages. Primary lesion N1 stage, n = 20; primary lesion N0 stage, n = 14; lymph node metastasis N1 stage, n = 21; normal lymph node N1 stage, n = 4; Recurrent tumour, n = 1. Data source: GSE60542. Primary lesion N1 stage = 5.21 ± 0.28; primary lesion N0 stage = 5.14 ± 0.21; lymph node metastasis N1 stage = 5.24 ± 0.35; normal lymph node N1 stage = 5.29 ± 0.26; Recurrent tumour = 6.02. **P < 0.01. (E) RDM1 expression in 568 pairs of PTCs and normal thyroid tissue from TCGA RNA-seq data (normal thyroid, n = 58; PTC, n = 510). PTC = 20.51 ± 0.73; normal thyroid = 7.26 ± 1.45. **P < 0.01. (F) Disease-free survival (Kaplan–Meier) curves. Cases with alteration (mRNA expression z-scores choose >2 or <−2) were 24 (relapsed n = 7, 29.17%), without alteration were 469 (relapsed n = 41, 8.74%).

 This work is licensed under a