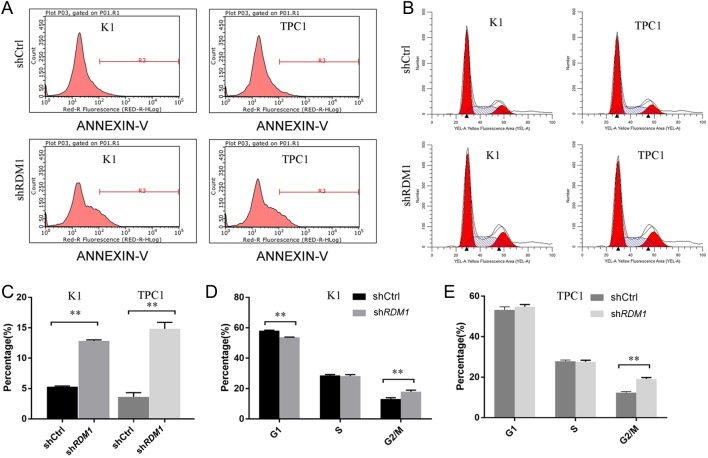
Figure 4.
Effect of the downregulation of RDM1 on K1 cells. (A) and (C) RDM1-siRNA enhanced cell apoptosis (n = 3). Flow cytometry analyses of apoptosis were shown in shRDM1 and control vector in K1 and TPC1 cells. The apoptosis rate was observed to be 5.3 ± 0.1% (shCtrl) and 12.8 ± 0.2% (shRDM1) in K1 cells. The apoptosis rate was observed to be 3.6 ± 0.7% (shCtrl) and 14.8 ± 1.1% (shRDM1) in TPC1 cells. **P < 0.01, compared with shCtrl. (B), (C) and (E) RDM1 expression affects cell cycle distribution (n = 3). The cell cycle analyses of shRDM1 and control vector in K1 cells were 18.0 ± 1.0% and 13.2 ± 0.8% in the G2/M phase, and 58.2 ± 0.3% and 53.8 ± 0.2% in the G1/S phase. The cell cycle analyses of shRDM1 and control vector in TPC1 cells were 19.1 ± 0.7% and 12.3 ± 0.5% in the G2/M phase, and 54.8 ± 1.1% and 53.2 ± 1.6% in the G1/S phase. **P < 0.01, compared with shCtrl.

 This work is licensed under a