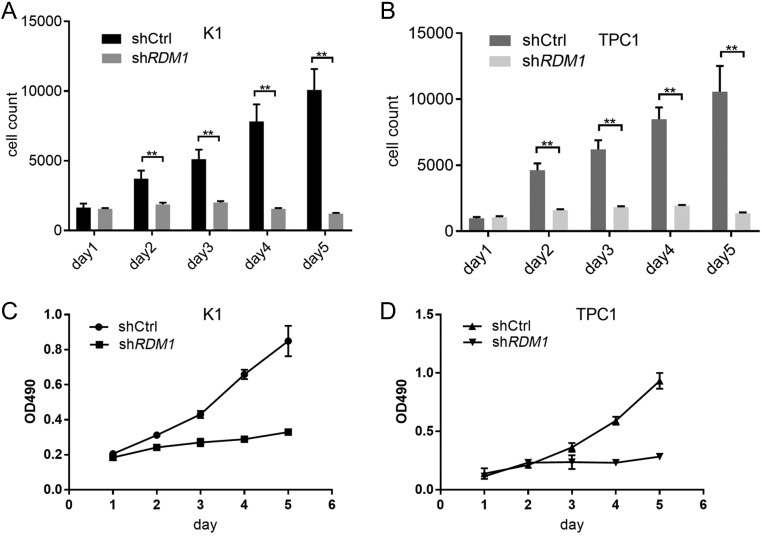
Figure 5.
Growth analysis of K1 and TPC1 cells after infected with lentivirus (n = 3). The proliferation of K1 and TPC1 cells was inhibited slightly by RDM1-siRNA, and analysed by Celigo cytometer and MTT. (A) and (B) Cell growth rate using Celigo cytometer. Cell growth rate was defined as the cell count of Nth day/cell count of 1st day. K1 and TPC1 cells infected shCtrl grew quickly; however, those cells infected shRDM1 which showed growth retardation. **P < 0.01. (C) and (D) Growth curves by MTT. The K1 cell density OD 490 in the presence of RDM1-siRNA and in the control group were 0.24 ± 0.01 and 0.31 ± 0.00, respectively, on day 2; 0.33 ± 0.01 and 0.85 ± 0.09, respectively, on day 5. The TPC1 cell density compared with shRDM1 and shCtrl were 0.21 ± 0.00 and 0.23 ± 0.01, respectively, on day 2; 0.29 ± 0.03 and 0.93 ± 0.07, respectively, on day 5.

 This work is licensed under a