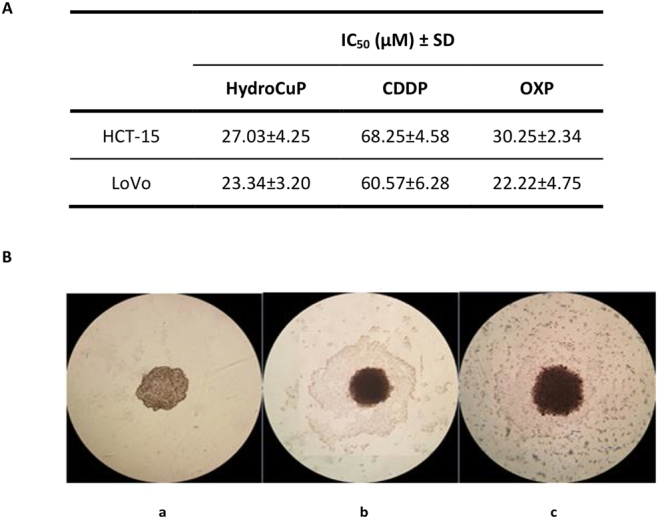
Figure 1.

Activity in 3D cell cultures. (A) Spheroids (2.5 × 10³ cells/well) were treated for 72 h with increasing concentrations of tested compounds. The growth inhibitory effect was evaluated by means of APH test. IC50 values were calculated from the dose-survival curves by four parameter logistic model (P < 0.05). SD = standard deviation. (B) Representative images (10x) of HCT-15 3D culture: a = controls; b = spheroids treated with IC50 concentrations of HydroCuP for 24 h; c = spheroids treated with IC50 concentrations of HydroCuP for 48 h.
