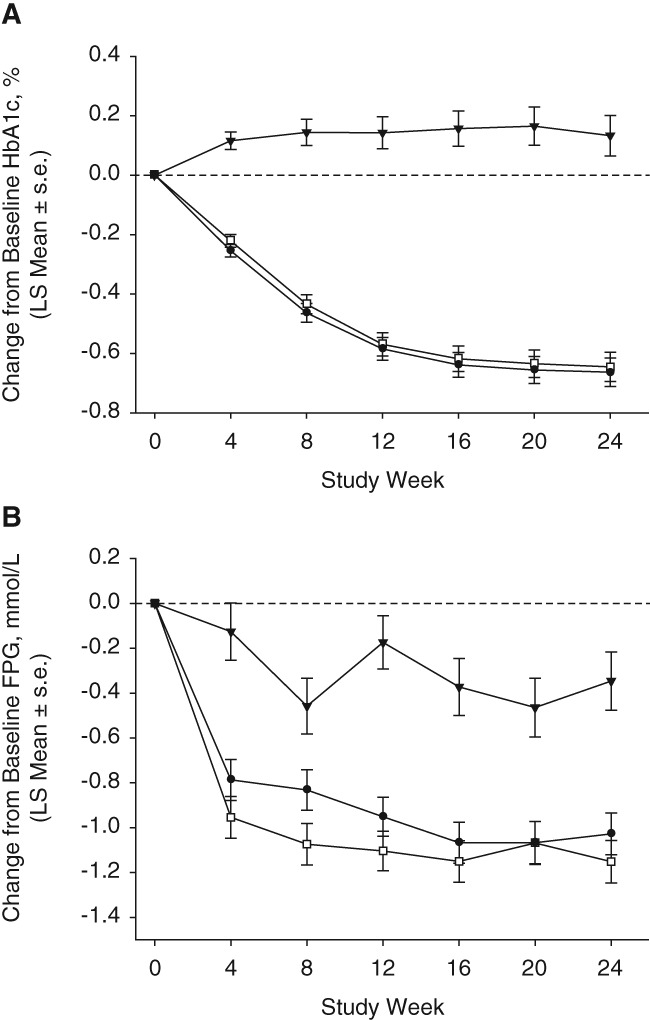
Figure 1.

Efficacy measures up to week 24; A, HbA1c; B, FPG; (black triangles, placebo; white squares, sitagliptin; black circles, omarigliptin; based on an LDA model with terms for treatment, prior AHA therapy status (yes/no), time, and interaction of time by treatment, time by prior AHA therapy status, and time by treatment by prior AHA therapy status, with the constraint that the mean baseline was the same for all treatment groups). s.e., standard error
