
Figure 1.
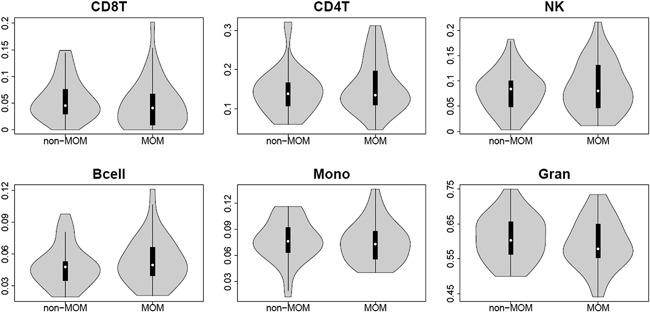
Cell‐composition estimates. Violin plots of different cell‐type (CD8+ T‐cells, CD4+ T‐cells, natural killer (NK) cells, B‐cells, monocytes and granulocytes) illustrating the distributions for non‐MOM THR and MOM HR samples after quality control. The white point shows the median value.