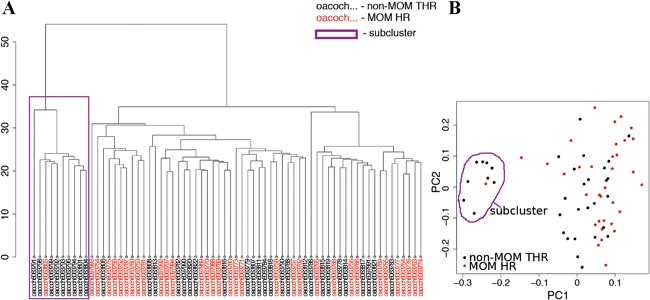
Figure 2.

Sample clustering. (A) A dendrogram depicting results of unsupervized clustering using the “hclust” function in R shows a formation of a sub‐cluster (purple box), (B) which is confirmed using principal component analysis. Samples forming the sub‐cluster are adjacent in the methylation plate and likely represent a technical issue.
