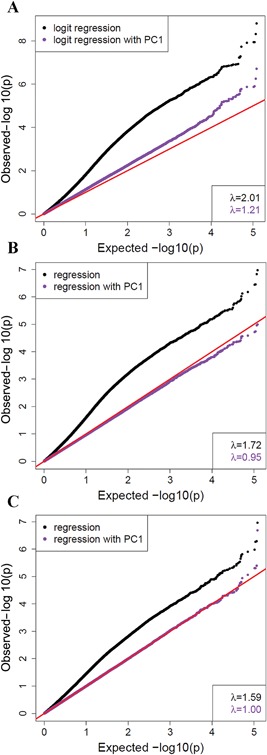
Figure 3.

Quantile‐quantile plots for association of probe methylation levels with either (A) sample case/control status, (B) cobalt levels, or (C) chromium levels. The x‐axis is −log10 of the expected p values under the null hypothesis of no association, and the y‐axis is −log10 of the observed p values. Red line represents equality between observed and expected values. The p values were obtained from logistic regression using ten covariates (black), with a very high inflation (λ values inset) suggesting potential confounding. Logistic regression with an additional co‐variate of 1st principal component (PC, purple) to account for sub‐clustering of samples (potentially due to technical confounding) shows reduced inflation.
