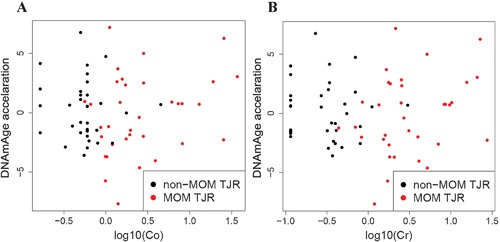
Figure 4.

DNAmAge acceleration and (A) cobalt or (B) chromium levels in samples. The y‐axis is the measure of age acceleration (residuals from regression of DNAmAge on age‐at‐sample), the x‐axis shows the cobalt or chromium levels (log10‐transformed). There is no significant correlation of age acceleration with either cobalt or chromium levels (p > 0.9).
