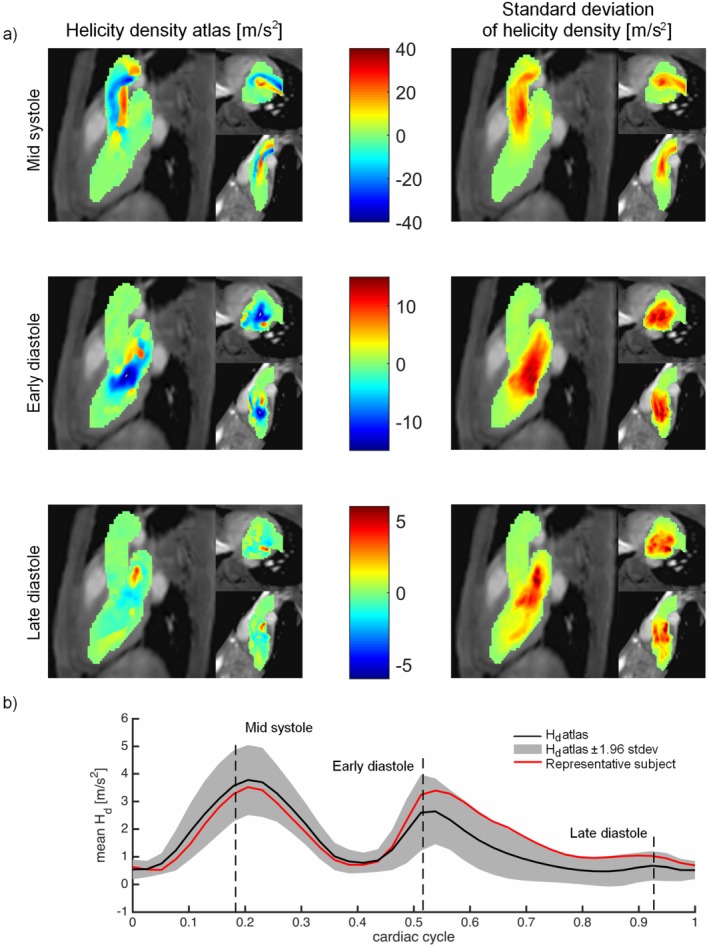
Figure 5.

(a) MIPs of the helicity density (Hd) atlas (m/s2) generated by the proposed method. The results are shown in three orientations: three‐chamber view, short‐axis view, and two‐chamber view. Top: mid‐systole, middle: early diastole; and bottom: late diastole. Left: mean Hd, right: standard deviation of the Hd. (b) Mean Hd throughout the cardiac cycle. The black line shows the mean value of the Hd atlas, the gray area shows the Hd atlas ± 1.96 standard deviation, and the red line shows the mean Hd of a representative subject. Note that mean values were calculated using the absolute magnitude of Hd.
