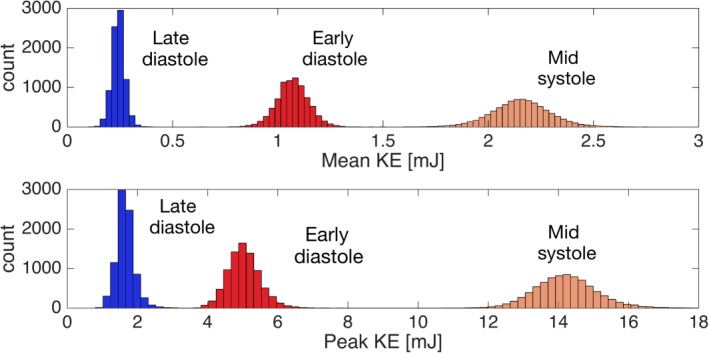
Figure 8.

Histogram showing the mean (upper panel) and peak (lower panel) KE (mJ) for all possible KE atlases using the subsets of the study population (n = 8191) at mid‐systole, early diastole and late diastole. The x‐axis shows the KE (mJ) values and the y‐axis shows the count of subsets.
