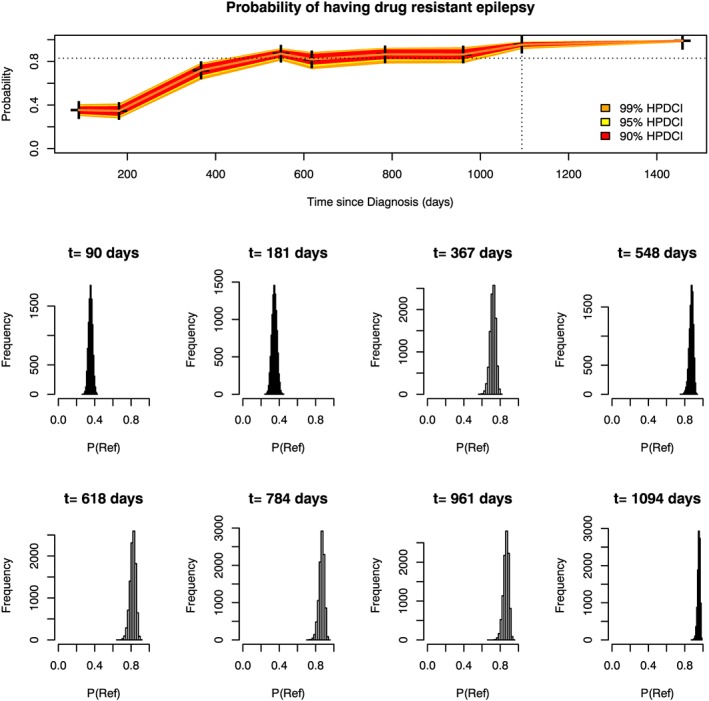
Figure 2.

Marginal group membership probabilities over time for patient A (top panel). Histograms showing the posterior distribution of the probability of being in the refractory group are shown for each clinic visit below the top panel. The dotted vertical line denotes the time at which the patient was classified as refractory using the dynCI scheme with 99% credible intervals. The dotted horizontal line shows the required cutoff of 0.83 [Colour figure can be viewed at wileyonlinelibrary.com]
