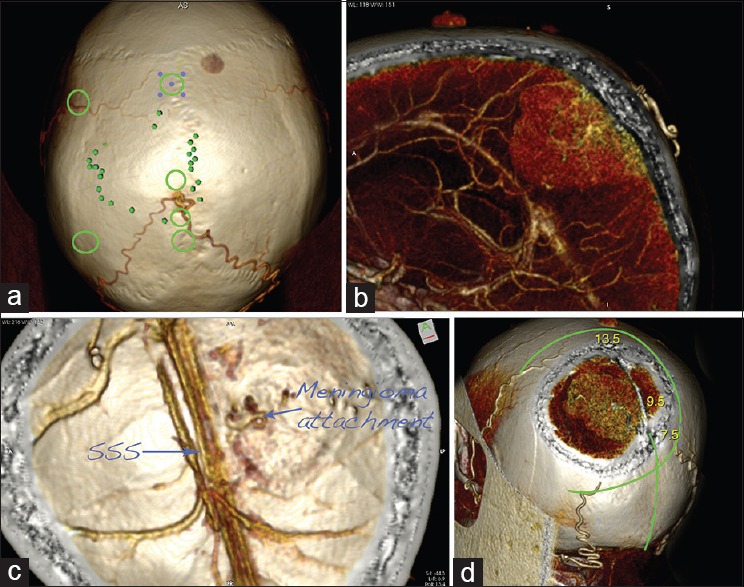
Figure 6.

Planning of a case of supratentorial parasagittal meningioma surgery: CT angiography–based 3D reconstructions. (a) The projection of the tumor over the cranium is marked with the small green dots. Note that the tumor is fed by the two occipital arteries, joining together. The green circles mark the location of the burr holes. (b) Sagittal slide presenting the tumor and its major feeding from the occipital arteries. (c) The calvarium is seen from inside. Note the origin of the tumor and the patent superior sagittal sinus (SSS). (d) Planning of the skin incision and craniotomy. The numbers give the beginning of the tumor (7.5 cm), the location of the blood supply (9.5 cm), and the end of the tumor (13.5 cm), measured from the inion
