
Figure 1.
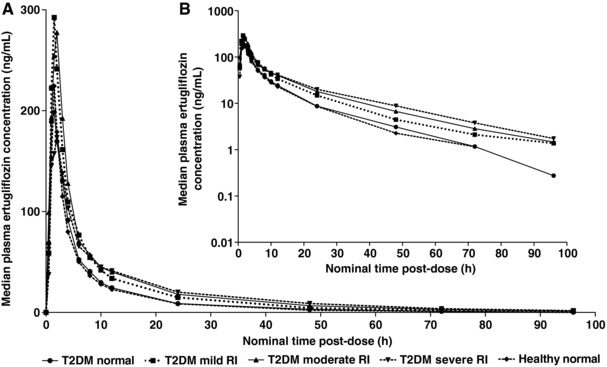
Median plasma ertugliflozin concentration‐time profiles following a single 15‐mg oral dose by renal function group. Plots show linear (A) and semilogarithmic (B) scales, respectively. Summary statistics were calculated by setting concentration values below the LLOQ to 0. The LLOQ was 0.500 ng/mL. Renal function groups were based on BSA‐unnormalized eGFR. Normal renal function, eGFR ≥90 mL/min; mild renal impairment, eGFR 60‐89 mL/min; moderate renal impairment, eGFR 30‐59 mL/min; severe renal impairment eGFR <30 mL/min. BSA indicates body surface area; eGFR, estimated glomerular filtration rate; h, hour; LLOQ, lower limit of quantification; RI, renal impairment; T2DM, type 2 diabetes mellitus.