
Figure 7.
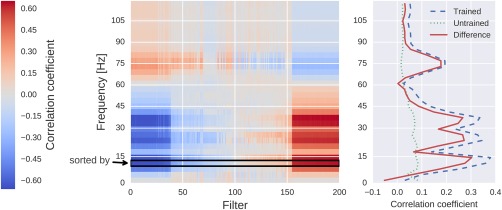
Correlation between the mean squared envelope feature and unit output for a single subject at one electrode position (FCC4h). Left: All correlations. Colors indicate the correlation between unit outputs per convolutional filter (x‐axis) and mean squared envelope in different frequency bands (y‐axis). Filters are sorted by their correlation to the 7–13 Hz envelope (outlined by the black rectangle). Note the large correlations/anticorrelations in the alpha/beta bands (7–31 Hz) and somewhat weaker correlations/anticorrelations in the gamma band (around 75 Hz). Right: mean absolute values across units of all convolutional filters for all correlation coefficients of the trained model, the untrained model and the difference between the trained and untrained model. Peaks in the alpha, beta, and gamma bands are clearly visible. [Color figure can be viewed at http://wileyonlinelibrary.com]