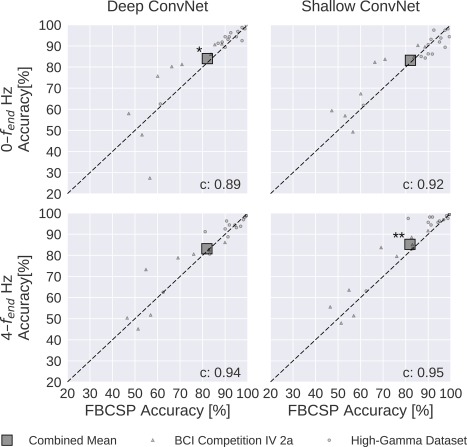
Figure 9.

FBCSP versus ConvNet decoding accuracies. Each small marker represents the accuracy of one subject, the large square markers represent average accuracies across all subjects of both datasets. Markers above the dashed line indicate experiments where ConvNets performed better than FBCSP and opposite for markers below the dashed line. Stars indicate statistically significant differences between FBCSP and ConvNets (Wilcoxon signed‐rank test, P < 0.05: *, P < 0.01: **, P < 0.001=***). Bottom left of every plot: linear correlation coefficient between FBCSP and ConvNet decoding accuracies. Mean accuracies were very similar for ConvNets and FBCSP, the (small) statistically significant differences were in direction of the ConvNets. [Color figure can be viewed at http://wileyonlinelibrary.com]
