
Figure 10.
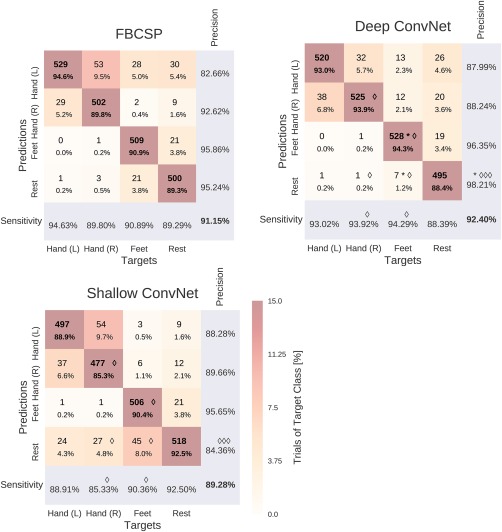
Confusion matrices for FBCSP‐ and ConvNet‐based decoding. Results are shown for the High‐Gamma Dataset, on 0–fend Hz. Each entry of row r and column c for upper‐left 4×4‐square: Number of trials of target r predicted as class c (also written in percent of all trials). Bold diagonal corresponds to correctly predicted trials of the different classes. Percentages and colors indicate fraction of trials in this cell from all trials of the corresponding column (i.e., from all trials of the corresponding target class). The lower‐right value corresponds to overall accuracy. Bottom row corresponds to sensitivity defined as the number of trials correctly predicted for class c/number of trials for class c. Rightmost column corresponds to precision defined as the number of trials correctly predicted for class r/number of trials predicted as class r. Stars indicate statistically significantly different values of ConvNet decoding from FBCSP, diamonds indicate statistically significantly different values between the shallow and deep ConvNets. P<0.05: /*, P<0.01: /**, P<0.001: /***, Wilcoxon signed‐rank test. [Color figure can be viewed at http://wileyonlinelibrary.com]