
Figure 11.
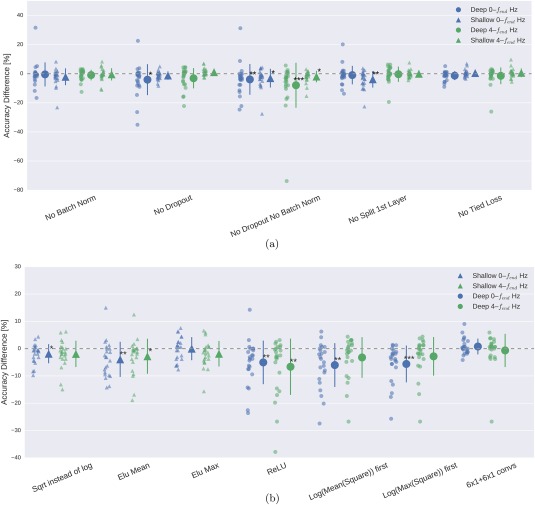
Impact of ConvNet design choices on decoding accuracy. Accuracy differences of baseline and design choices on x‐axis for the 0–fend‐Hz and 4–fend‐Hz datasets. Each small marker represents accuracy difference for one subject, and each larger marker represents mean accuracy difference across all subjects of both datasets. Bars: standard error of the differences across subjects. Stars indicate statistically significant differences to baseline (Wilcoxon signed‐rank test, P < 0.05: *, P < 0.01: **, P < 0.001=***). (a) Impact of design choices applicable to both ConvNets. Shown are the effects from the removal of one aspect from the architecture on decoding accuracies. All statistically significant differences were accuracy decreases. Notably, there was a clear negative effect of removing both dropout and batch normalization, seen in both ConvNets' accuracies and for both frequency ranges. (b) Impact of different types of nonlinearities, pooling modes and filter sizes. Results are given independently for the deep ConvNet and the shallow ConvNet. As before, all statistically significant differences were from accuracy decreases. Notably, replacing ELU by ReLU as nonlinearity led to decreases on both frequency ranges, which were both statistically significant. [Color figure can be viewed at http://wileyonlinelibrary.com]