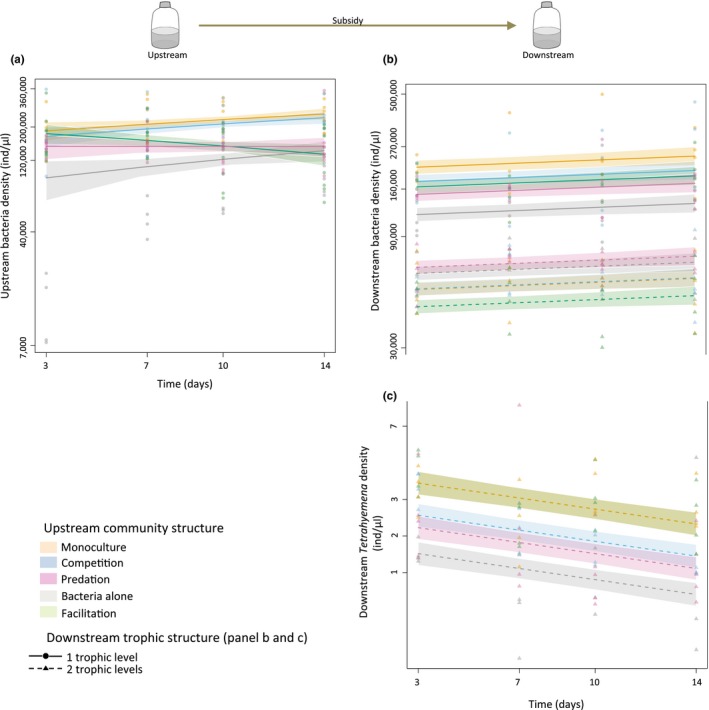
Figure 2.

Effect of upstream community structure on upstream bacteria density (panel a), and on downstream bacteria (panel b) and Tetrahymena (panel c) densities in the one‐trophic‐level (full lines—Tetrahymena absent) and in the two‐trophic‐level (dashed lines—Tetrahymena present) communities. Points (Tetrahymena absent), and triangles (Tetrahymena present) represent raw data. Full and dashed lines represent model predictions with 95% confidence intervals as shadings. Y‐axes on all panels are on log‐scale, but for clarity tick numbers represent raw densities. On panel c, model predictions for Facilitation (2.81 ± 1.25 ind/μl) and Monoculture (2.76 ± 1.05 ind/μl) are completely overlapped, and on panel b (dashed lines) Monoculture (55370 ± 15486 ind/μl) is visible just under Competition (55670 ± 17169 ind/μl)
