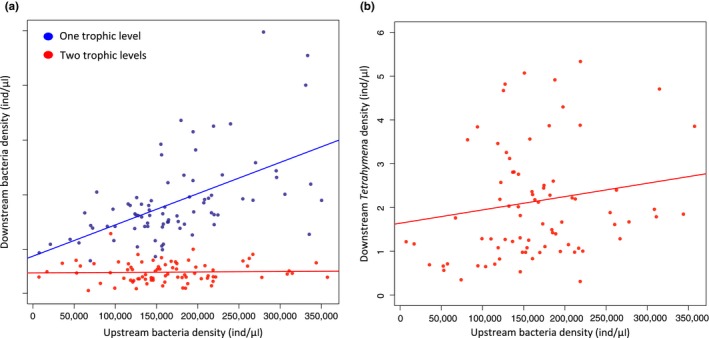
Figure 3.

Effect of upstream bacteria density on (a) downstream bacteria density in the absence (blue dots) and in the presence (red dots) of Tetrahymena and (b) downstream Tetrahymena density. Data points on each panel represent all treatments and experimental days
