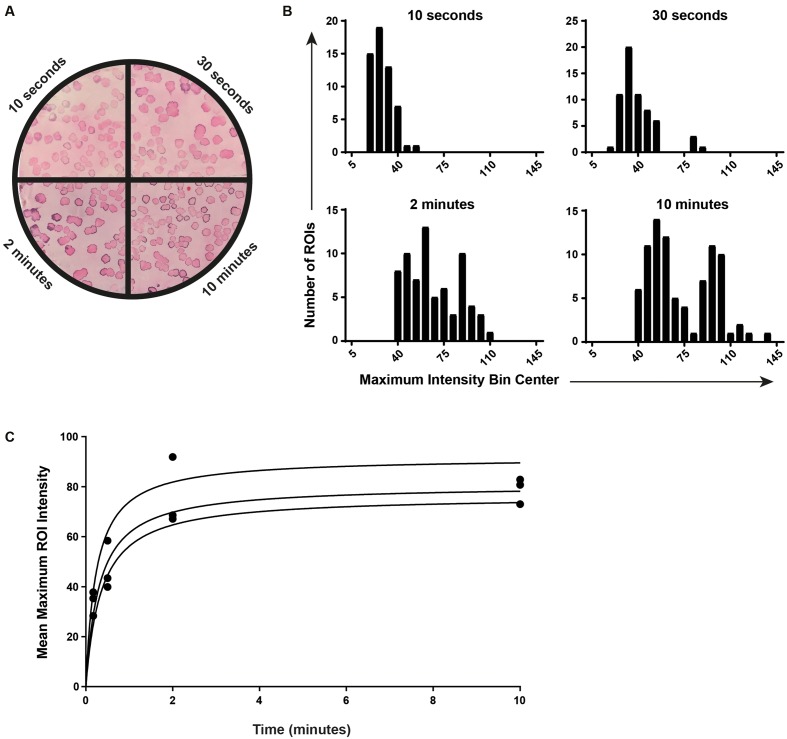
FIGURE 6.
Optimization of the incubation time with the chromogenic substrate. (A) Equal mixtures of SL1344 ΔhilC and SL1344 wild-type were plated on MacConkey agar to obtain approximately 50–250 colonies. An anti-SipC ColoBlot was performed. Prior to exposure of the membrane to the 4-chloro-1-naphthol reagent mixture, the membrane was cut into four equal parts (representative images for each quadrant are shown divided by a black line). Each quadrant was exposed to 4-chloro-1-naphthol in the presence of H2O2 for 10 s, 30 s, 2 min, or 10 min (as indicated). (B) CIIA was performed on each quadrant independently and the resulting maximum intensity histograms are shown (representative histograms of the membrane shown in A). (C) The mean maximum intensity for each ROI (i.e., the mean maximum intensity for each histogram in B) in each quadrant is plotted as a function of time. Three membranes are plotted and hyperbolic curves are fit (R2 = 0.9119, 0.9703, and 0.931).

