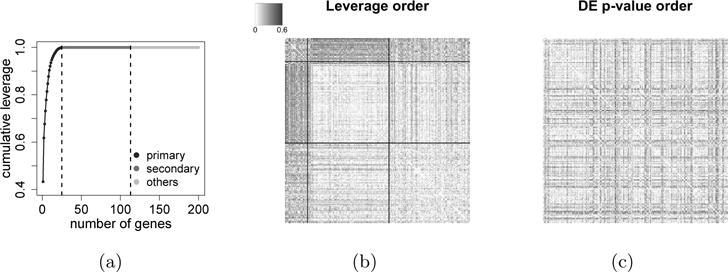
Fig. 2.

Visualization of 200 genes in the M2c module, including 25 primary genes that account for a total leverage of 0.999, 88 secondary genes that account for the remaining 0.001 leverage, and 87 randomly selected other genes that have zero leverage. (a) Scree plot of cumulative leverage. (b) Heatmap of where genes are ordered by leverage and a block structure is revealed. The two partitioning lines indicate the 25 primary genes and the 88 secondary genes. (c) Heatmap of where genes are ordered by p-values in differential expression analysis. Now the block structure is diluted.
