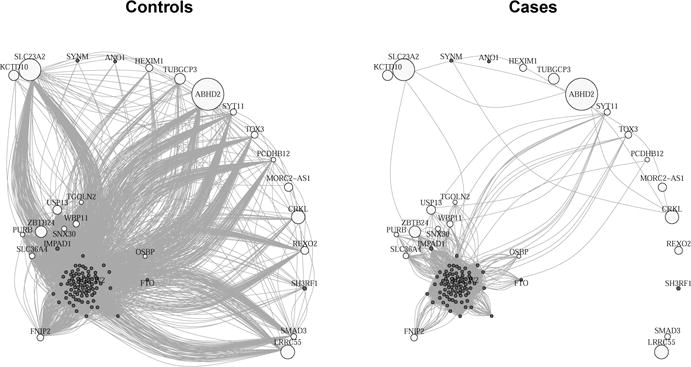
Fig. 3.

Gene networks constructed from control and SCZ samples, using top genes in the M2c module that have non-zero leverage. We exclude 6 genes that do not have annotated gene names, and show the remaining 22 primary genes (colored in white) and 85 secondary genes (colored in grey). The adjacency matrix is constructed by thresholding the absolute Pearson correlation |Rij| at 0.5. Larger node sizes represent larger leverage.
