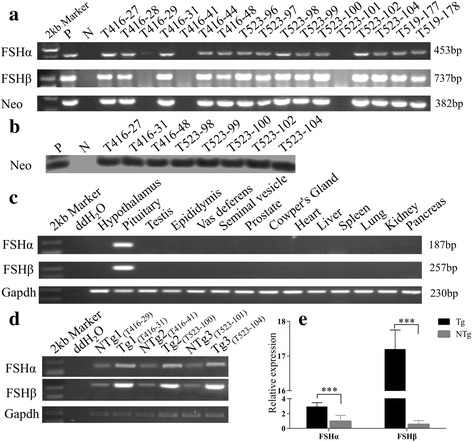
Fig. 2.

Identification of exogenous FSHα/β insertion and expression analysis. (a) Identification of F1 transgenic pigs by PCR using DNA obtained from ear tissue. P, a single F0 transgenic pig as positive control; N, a single non-transgenic Large White pig as negative control; T416–27, 28, 29, 31, 41, T523–96, 97, 98, 99, 100, 101, 102, 104, and T519–177, 178 are identifiers for F1 transgenic pigs. (b) Southern blot for transgenic pig identification. The Neo gene in transgenic pigs was detected using the probe shown in Fig. 1. DNAs were digested with AvaII and PstI to generate a target fragment of 463 bp. (c) RT-PCR analysis of FSHα and FSHβ from pituitary and 13 other tissues. GADPH was used as a control. (d) RT-PCR analysis of FSHα and FSHβ expression using mRNA from the pituitaries of six transgenic pigs. (e). FSHα and FSHβ mRNA expression levels in the pituitaries of Tg and NTg pigs analyzed using qPCR. Relative expression was calculated relative to β-actin (reference gene). Values are expressed as means ± SEM. ***, P < 0.001
