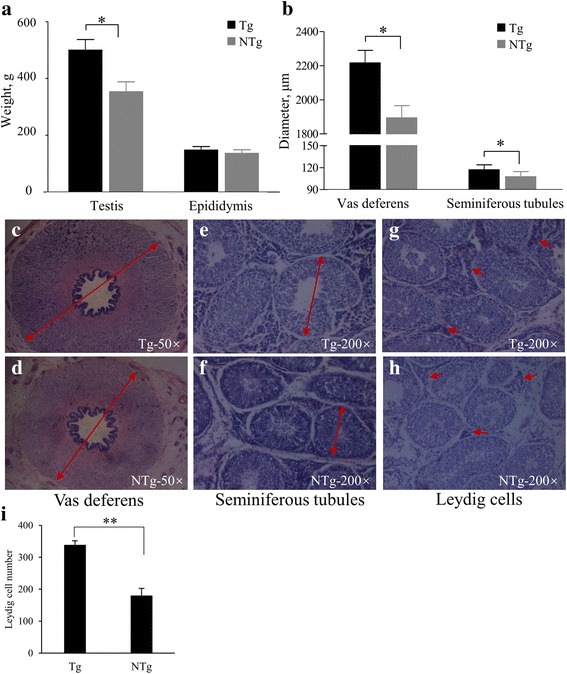
Fig. 4.

Histological assessment of reproductive tissue from F1 boars. (a) Comparison of testis and epididymis weight in Tg and NTg boars. (b) Vas deferens and seminiferous tubule diameters in Tg and NTg boars. (c-i) Histological sections of testis tissue. (c-d) Vas deferens at 50× magnification. Red arrows span the vas deferens diameter. (e-f) Seminiferous tubules at 200× magnification. Red arrows span tubule diameter. (g-h) Leydig cells at 200× magnification. Red arrows indicate Leydig cells between the seminiferous tubules. (i) The number of Leydig cells in Tg and NTg boars. Data are expressed as means ± SEM. *, P < 0.05. **, P < 0.01
