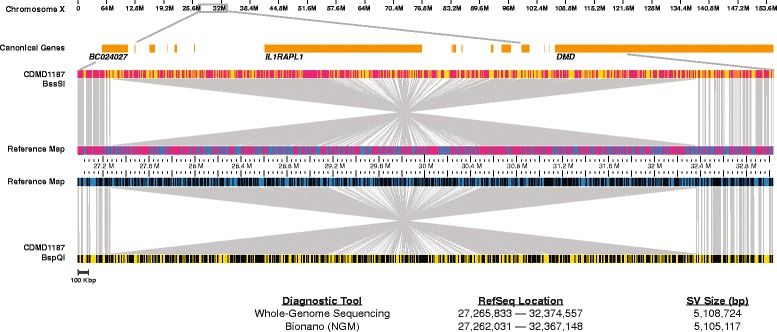
Fig. 8.

NGM identified a 5.1-Mbp inversion disrupting DMD. Top: X chromosome and Ref-Seq genes (orange) present in the magnified region. Visual representation of the inversion where the middle section of the reference (blue) and patient (yellow) maps have inverted alignments. The sample maps were generated using Nb.BssSI (top) and Nt.BspQI (bottom) endonucleases. Nicked sites are represented by red (Nb.BssSI) or black (Nt.BspQI) vertical lines in the middle reference and top/bottom sample maps
