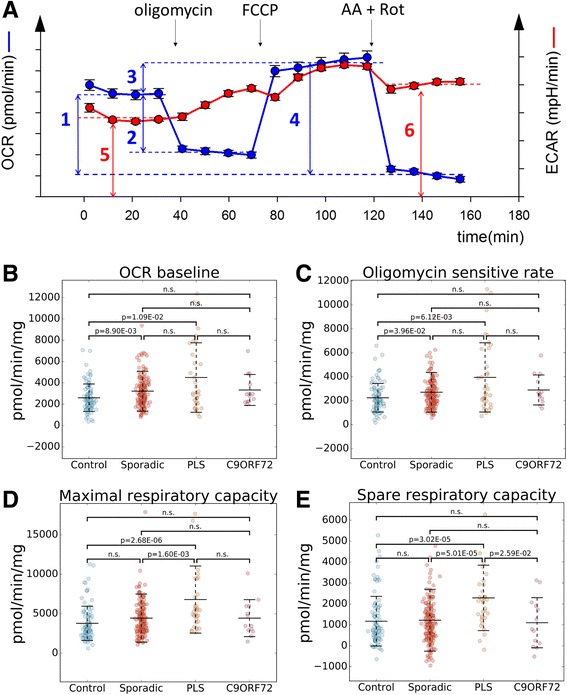
Fig. 2.

Higher oxygen consumption rates in sALS and PLS fibroblasts. a Schematic illustration of a typical flux experiment and the calculated metrics (1: OCR baseline, 2: oligomycin sensitive rate, 3: spare respiratory capacity, 4: maximal respiratory capacity, 5: ECAR baseline, 6: ECAR AA-Rot). B-E: scatter plots of OCR baseline b Control mean: 2606.9, SD: 1290.5; sALS mean: 3224.0, SD: 1864.5; PLS mean: 4504.6, SD: 3259.3; C9Orf72 mean: 3338.2, SD: 1450.7), oligomycin sensitive rate c Control mean: 2248.2, SD: 1193.9; sALS mean: 2707.6, SD: 1656.9; PLS mean: 3947.9, SD: 2892.3; C9Orf72 mean: 2900.4, SD: 1251.4), maximal respiratory capacity d Control mean: 3784.6, SD: 2166.9; sALS mean: 4445.7, SD: 3048.2; PLS mean: 6797.1, SD: 4247.2; C9Orf72 mean: 4443.5, SD: 2339.5), spare respiratory capacity e Control mean: 1177.7, SD: 1187.2; sALS mean: 1221.7, SD: 1476.5; PLS mean: 2292.5, SD: 1563.6; C9Orf72 mean: 1105.3, SD: 1195.8). Values are shown comparing sALS, PLS, C9Orf72, and control lines. Middle bars represent the average values and error bars show standard deviations. p-values are indicated where there was a significant difference between two groups. n.s.: no significant difference. n = 171 sALS; n = 34 PLS, n = 13 C9Orf72, n = 91 controls
