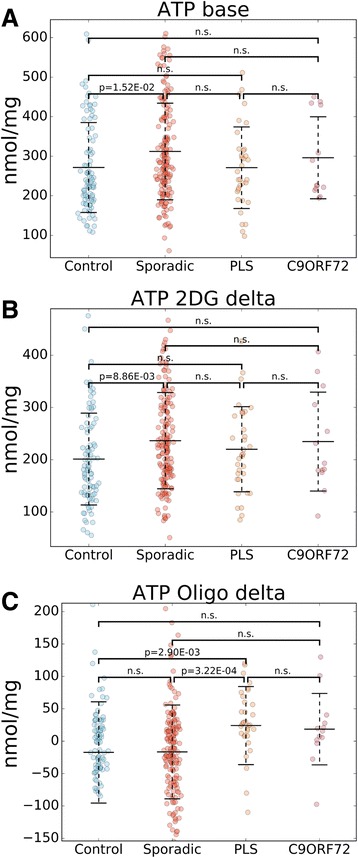
Fig. 4.

ATP content in sALS and PLS fibroblasts. Scatter plots of baseline ATP content a Control mean: 271.6, SD: 113.7; sALS mean: 312.1, SD: 122.2; PLS mean: 271.1, SD: 103.2; C9Orf72 mean: 296.1, SD: 103.8), ATP content lost after 2DG treatment b Control mean: 201.2, SD: 87.8; sALS mean: 236.4, SD: 92.1; PLS mean: 220.1, SD: 81.4; C9Orf72 mean: 234.7, SD: 94.6), and ATP content lost after oligomycin treatment c Control mean: -17.3, SD: 78.1; sALS mean: -16.6, SD: 72.4; PLS mean: 24.1, SD: 60.2; C9Orf72 mean: 18.6, SD: 55.1) are shown comparing sALS, PLS, C9Orf72, and control lines. Groups were compared using Kruskal–Wallis one-way analysis of variance followed by Dunn’s post hoc analysis. Middle bars represent the average values and error bars show standard deviations. p-values are indicated where there was a significant difference between two groups. n.s.: no significant difference. n = 171 sALS; n = 34 PLS, n = 13 C9Orf72, n = 91 controls
