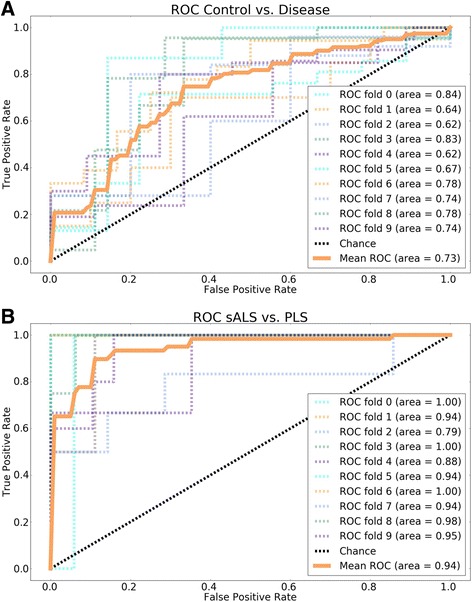
Fig. 5.

Receiver operating characteristic (ROC) curves of SVM classifiers distinguishes lines with motor neuron disease from controls (a), and sALS from PLS (b). SVMs were trained to distinguish between two groups, based on 12 bioenergetics features. Each continuous orange ROC curve represents the mean of 10 cross-validation curves, each shown as a dotted line. Values of the area under the curve for each ROC curve (0–9 fold ROC and mean ROC) are indicated in the boxes
