Fig. 4.

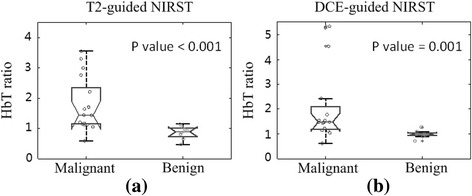
Boxplots of HbT contrast in malignant (n = 16) and benign (n = 8) groups obtained by a T2-guided and b DCE-guided methods, respectively. DCE dynamic contrast-enhanced, HbT total hemoglobin, NIRST near-infrared spectral tomography

Boxplots of HbT contrast in malignant (n = 16) and benign (n = 8) groups obtained by a T2-guided and b DCE-guided methods, respectively. DCE dynamic contrast-enhanced, HbT total hemoglobin, NIRST near-infrared spectral tomography