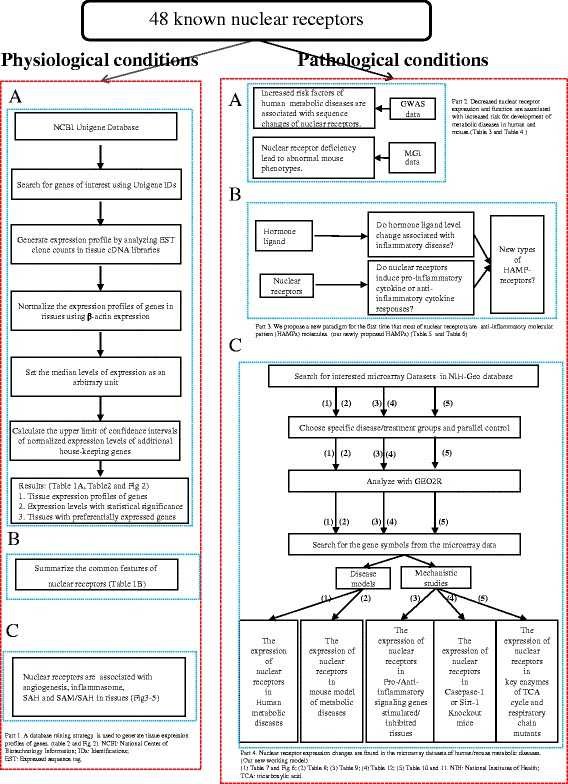
Fig. 1.

Flow chart of database mining strategy and two parts of data organization. Part1: shows the database mining strategy utilized to generate tissue nuclear receptor expression profile. Part 2: the strategy utilized to measure nuclear receptor expression in human and mouse metabolic diseases. Parts 3 and 4: shows the strategy that is used to analyze the microarray data sets and identifying nuclear receptors as homeostasis-associated molecular pattern receptors (HAMPRs)
