
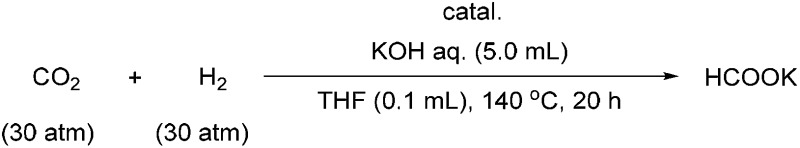
Table 1. The hydrogenation of CO2 to formate a .
| |||
| Entry | Catalyst (mol%) | Yield b (%) | TON c (×103) |
| 1 | 1a (0.1) | 93 | 0.9 |
| 2 | 1b (0.1) | 99 | 1 |
| 3 | 1a (0.001) | 23 | 23 |
| 4 | 1b (0.001) | 81 | 81 |
| 5 | 3a (0.001) | 22 | 22 |
| 6 | 3b (0.001) | 78 | 78 |
| 7 | 4 (0.001) | 5 | 5 |
| 8 | 5a (0.001) | 10 | 10 |
| 9 | 5b (0.001) | 14 | 14 |
| 10 | 6a (0.001) | 2 | 2 |
| 11 | 6b (0.001) | 8 | 8 |
| 12 | 7a (0.001) | 6 | 6 |
| 13 | 7b (0.001) | 1 | 1 |
| 14 | 7c (0.001) | 2 | 2 |
aGeneral reaction conditions: 5 mL aqueous 1 M KOH solution, 0.1 mol% or 0.001 mol% iridium catalyst relative to KOH in 100 μL THF, 60 atm of H2 : CO2 (1 : 1, initial), 140 °C, 20 h.
bYield, which represents conversion of the added KOH, based on 1H NMR analysis with sodium 3-(trimethylsilyl)-1-propanesulfonate as an internal standard.
cTON = turnover number; number of moles of product formed per mole of catalyst.