Fig. 2.

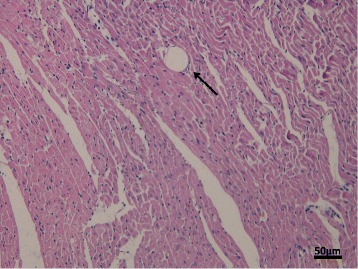
Histopathology of post-CME myocardial microinfarcts (×200), bar = 50 μm. Tissue samples’ HE stain from the CME group. The arrow reveals the exist of a 42-μm microsphere following CME

Histopathology of post-CME myocardial microinfarcts (×200), bar = 50 μm. Tissue samples’ HE stain from the CME group. The arrow reveals the exist of a 42-μm microsphere following CME