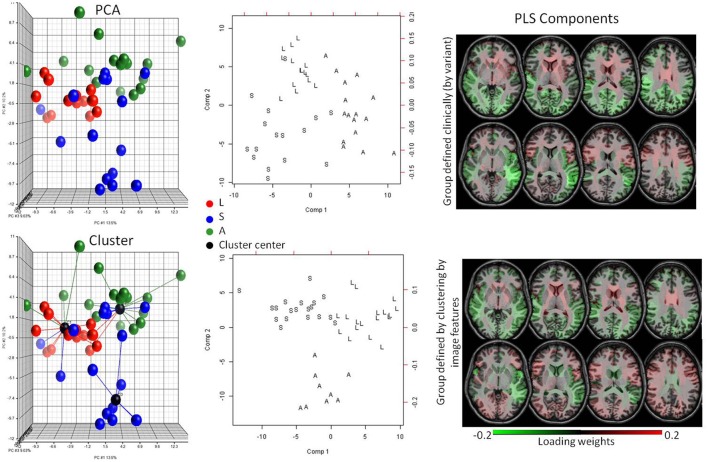
Figure 5.
Potential of detecting subgroups in heterogeneous pathologies. The top row is a supervised analysis, with knowledge about the PPA variant; the bottom row is unsupervised, based only on image features. The colors in the plots code three PPA variants (L = logopenic, S = semantic, A = agrammatic). The PCA plot (top left) shows a natural segregation between the variants. Without any clinical information, the images are clustered with high accuracy (Rand Index = 0.71) (bottom left). The anatomical features extracted in the PLS-DA model (center) when patients are grouped by clinical information (top right) or clustered by image features (bottom right) are very similar, and agree with the anatomical features described for the variants, indicating that both methods yield groups based on the same anatomical pattern.

