
Fig. 2.
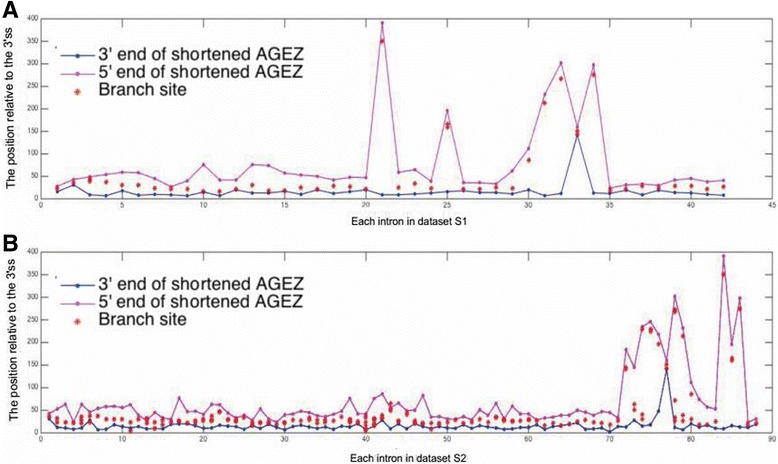
The endpoints (5′- and 3′-) of the shortened AGEZ and corresponding branch sites labelled by their positions relative to the 3’ss for each intron in Additional file 2: Dataset S1 (a) and Additional file 3: Dataset S2 (b). X-axis: No. of intron in Additional file 2: Dataset S1 (shown in Table S2) and Additional file 3: Dataset S2 (shown in Table S3). Y-axis: Position relative to the 3’ss. Each vertical line represents an intron, in which the dots with different colors depict the 5′/3′ end of the shortened AGEZ (purple/blue) and branch sites (red)