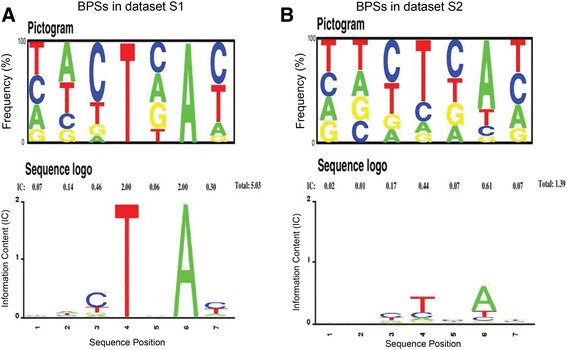
Fig. 3.

Pictogram and Sequence logo for BPSs in Additional file 2: Dataset S1 (a) and Additional file 3: Dataset S2 (b). In Pictogram, the height of each letter is proportional to the frequency of nucleotide at the given position; For Sequence logo, the height of letters describes the information content in bits at each position
