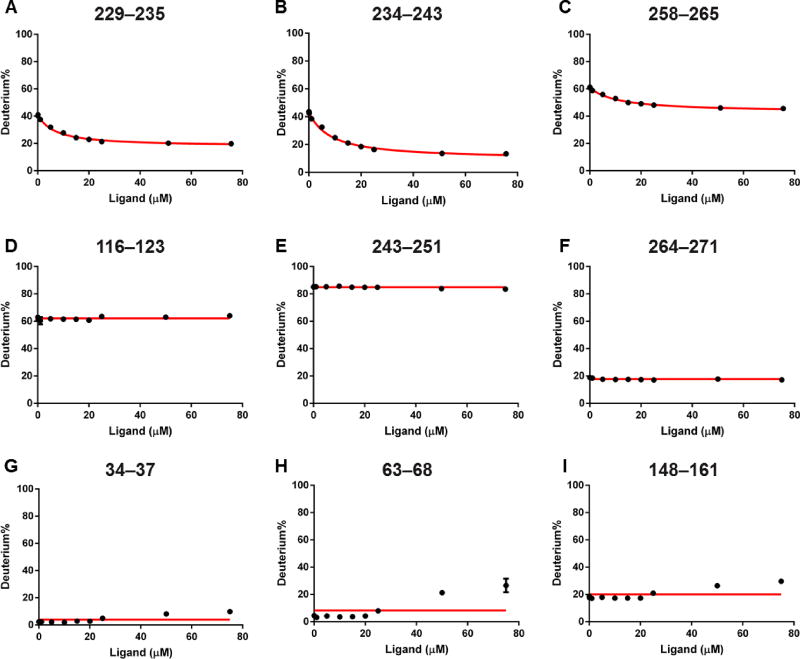
Figure 3.
PLIMSTEX curves of (A)–(C) of peptides representing putative binding sites that show a gradual HDX decrease; (D)–(F) representative peptides from both N-terminal and C-terminal domains displaying no HDX response against ligand concentration; (G)–(I) representative peptides in N-terminal domain showing increased HDX at high concentration of the ligand. Red lines in (A)–(C) are 1:1 fitting curves, and the horizontal lines are averaged HDX across all time points in (D)–(I).

