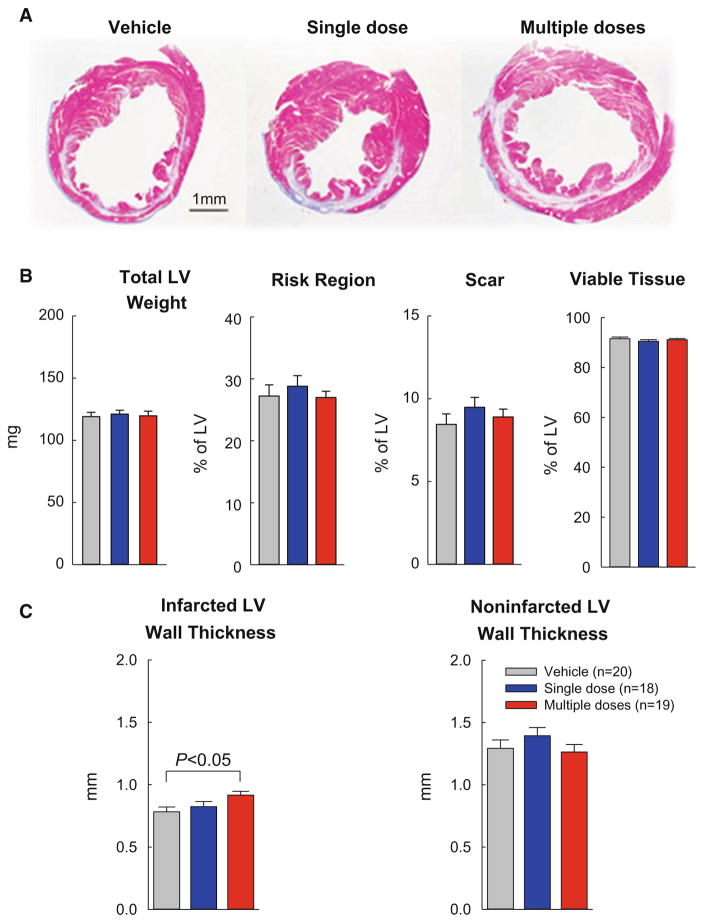
Fig. 5.
Morphometric analysis. A. Representative Masson trichrome-stained myocardial sections. Scar tissue and viable myocardium are identified in white/blue and red, respectively. b, c Quantitative analysis of LV morphometric parameters. The risk region comprises both the border zones and the scarred (infarcted) region. Data are mean ± SEM

