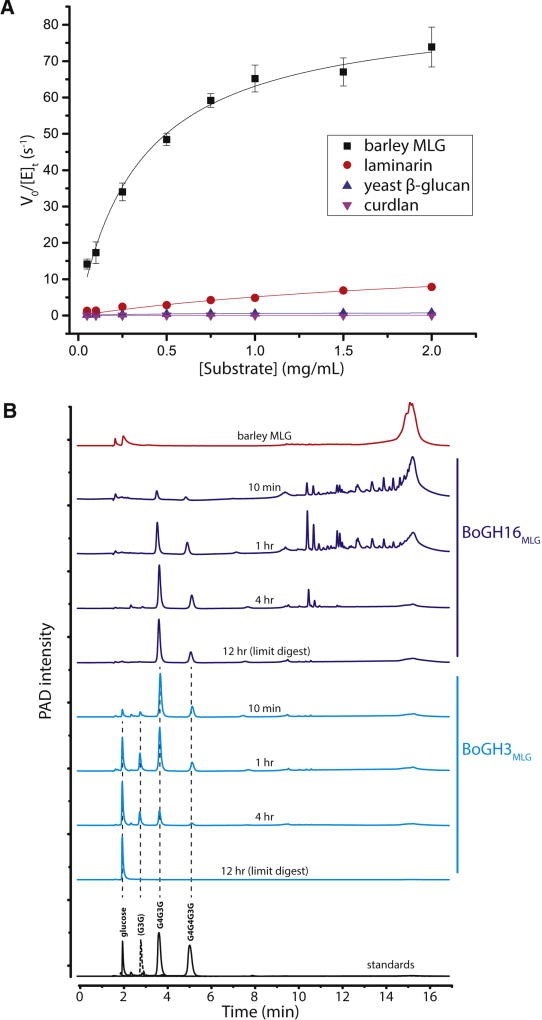
Figure 3. BoGH16MLG kinetics and MLGUL GHs product analysis.
A: BoGH16MLG initial-rate kinetics curves fitted to the Michaelis-Menten equation for β-glucan polysaccharide substrates on which it is active. Laminarin was reduced to laminaritol by sodium borohydride reduction to reduce background in the BCA assay. Curve fitting was done on OriginPro 2015 and error bars represent standard deviations from the mean. B: Chromatograms of bMLG and its hydrolysis products by BoGH16MLG and BoGH3MLG separated by HPAEC-PAD. Red: full length bMLG polysaccharide. Dark blue: reaction progress time course and limit digest of bMLG hydrolysis by 10 nM BoGH16MLG. Cyan: reaction progress time course and limit digest of BoGH16MLG products hydrolysis by 25 nM BoGH3MLG. Standards are shown below in black: solid lines are those corresponding to limit digest products and dotted line to intermediate products. See also Figures S3, S4 and S5; Tables S2 and S3.

