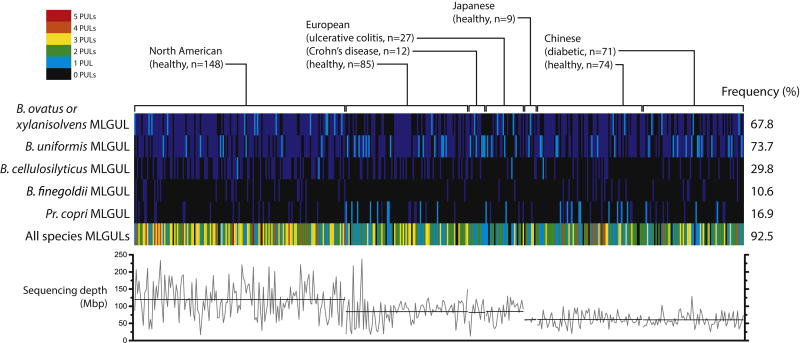
Figure 7. Bacteroidetes MLGULs from a survey of 426 adult human gut metagenomes.
Vertical lines represent the presence (cyan when unique, blue when one of multiple) or absence (black) of a corresponding species-related MLGUL in a single individual. The total number of MLGULs observed in an individual is shown in the bottom row, colored according to the legend in the top left corner. The frequency of MLGUL occurrence across all 426 individuals is shown on the right. Variation in sequencing depth in megabase pair is illustrated in the graph below: grey lines show the depth for individual subjects and black lines show the average depth of each metagenomics project.

